Statistics
Using hospital admissions statistics, Headway has compiled a dataset on all acquired brain injury (ABI) related hospital admissions in the UK. These include non-superficial head injuries, strokes, brain tumours, encephalitis, and a variety of additional conditions.
Prior to the global 2020 Covid-19 pandemic, we were seeing a gradual increase in the number of annual UK hospital admissions for acquired brain injury (ABI).
Since the pandemic, there has been a drop in the number of ABI hospital admissions in the UK, led mainly by a significant reduction in the number of head injury admissions. Research has attributed the reduction in head injury admissions to changes in societal behaviours during pandemic-related lockdown measures and changes in the mechanisms of injury, such as a reduction in head injury related road traffic collisions (see Lester, Leach and Zaben, 2021).
Whilst admissions for head injury have decreased since the pandemic, we continue to see an increase in hospital admissions for stroke and brain tumours.
Key statistics
- There were 335,409 UK hospital admissions for acquired brain injury (ABI) in 2023-24.
- There were approximately 919 ABI UK hospital admissions per day in 2023-24. This equates to one every 90 seconds.
- There were 123,969 UK hospital admissions for head injury in 2023-24. This equates to one every four minutes.
- Males were 1.5x more likely than females to be admitted to a UK hospital for a head injury in 2023-24.
- There were 143,446 UK hospital admissions for stroke in 2023-24. That equates to one every four minutes.
- There were 42,892 UK hospital admissions for brain tumours in 2023-24.

"Headway's work does provide the clearest picture to date of the pool of people who require support, from short-term advice and information, to long-term inpatient rehabilitation"
- Professor Alan Tenant, Emeritus Professor of Rehabilitation Studies, University of Leeds
Access the data sets
You can download the full data tables and infographic in the related resources section. This allows you to see the fine detail of hospital admissions by type of brain injury, age, year and location. This information can be used to support a wide range of brain injury-related needs from funding applications to service planning and campaigning.
About brain injury
This section gives an overview of the brain, brain injury and the practical issues that can arise.
Find out moreSupporting you test
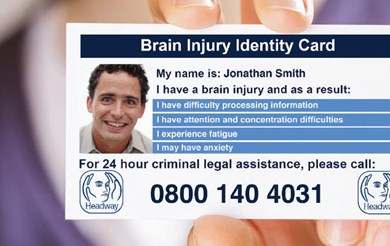
From local groups or branches, our Emergency Fund, Brain Injury Identity Card, helpline and much more, find out how Headway can support you after brain injury.
Find out more
